Introduction
Welcome to our comprehensive Blinkit analysis. Using data from March 2023 to November 2024, we have developed interactive Tableau visualizations that capture key trends—from sales and payment methods to customer behavior, delivery efficiency, inventory management, and marketing performance. Each section presents a visualization followed by detailed observations, insights, and actionable recommendations.
Sales & Payment Analysis
Money Talks: Decoding Blinkit's Financial Pulse & Payment Patterns
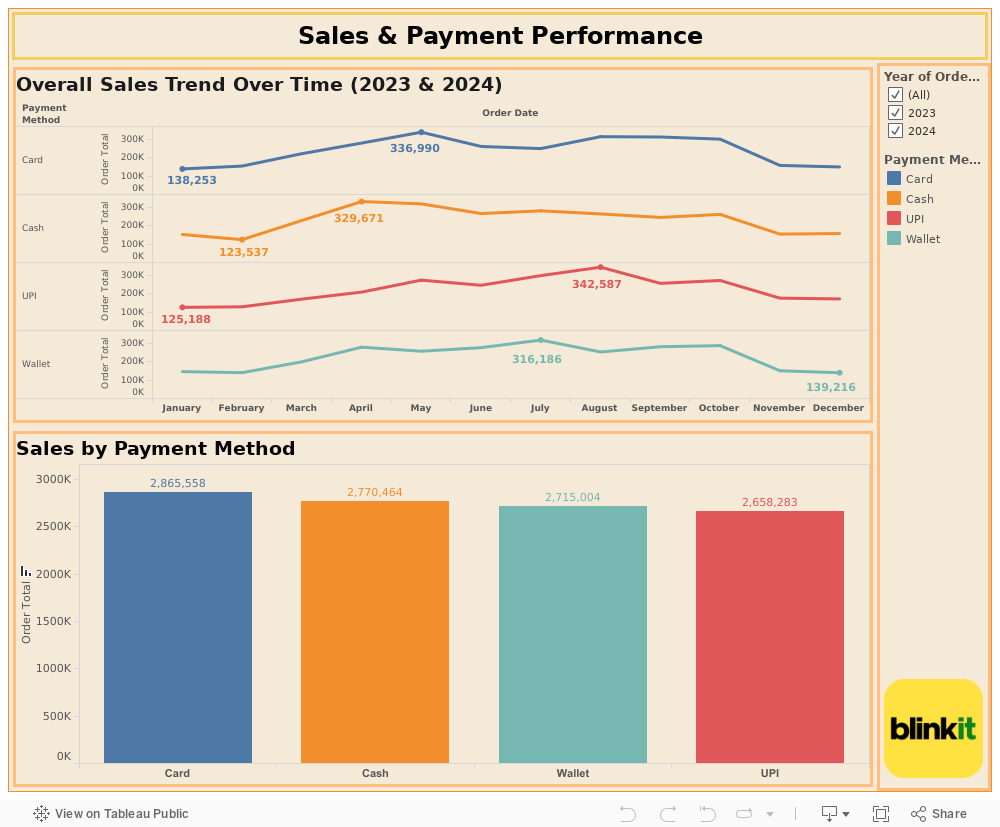
1. Payment Method Performance (2023 vs 2024)
- Card Transactions:
- 2023: ₹1,399,377
- 2024: ₹1,466,181
- Growth of 4.77% indicating increased trust in digital payments.
- Wallet Transactions:
- 2023: ₹1,378,039
- 2024: ₹1,336,965
- Decline of 2.98%, suggesting reduced promotional campaigns or fewer wallet users.
- Cash Transactions:
- 2023: ₹1,346,517
- 2024: ₹1,423,947
- Growth of 5.74%, which implies customers still prefer cash transactions despite digital alternatives.
- UPI Transactions:
- 2023: ₹1,340,825
- 2024: ₹1,317,458
- Decline of 1.75%, potentially due to competition from other payment methods.
2. Monthly Sales Trend Observations
- Peak Months:
- Card transactions peaked in May 2023 (₹193,157) and July 2024 (₹175,685).
- Cash transactions peaked in May 2024 (₹182,377).
- UPI payments peaked in August 2023 (₹183,242).
- Wallet transactions were at their highest in August 2023 (₹160,028).
- Declining Trends:
- November 2024 saw the lowest transactions across all methods, particularly for UPI (₹15,703).
- Card transactions dropped drastically in November 2024 (₹13,026).
- Wallet payments also hit a low in November (₹15,294).
Recommendations for Revenue Growth
- Strengthen Digital Payments (Card & UPI):
- Offer exclusive discounts for UPI and Card transactions to increase adoption.
- Implement loyalty rewards for repeat digital payment users.
- Target Low-Performing Months:
- November sales are significantly lower across all methods.
- Introduce special promotions or festive discounts to boost transactions.
- Leverage Seasonal Peaks:
- Since May and July show peak transactions, invest in marketing and cashback offers during these months to maximize revenue.
- Optimize Wallet Usage:
- Since wallet transactions declined by 2.98%, reintroduce wallet-specific cashback offers to encourage usage.
Customer Insights & Segmentation

Customer Chronicles: Unveiling User Personas & Purchase Patterns
1. Customer Segments vs. Total Orders
- New Customers: 6,829 total orders, indicating strong acquisition efforts.
- Regular Customers: 6,598 total orders, showing consistent repeat purchases.
- Premium Customers: 6,452 total orders, indicating a high-value segment.
- Inactive Customers: 6,350 total orders, suggesting a need for re-engagement strategies.
2. Customer Lifetime Value (CLV) Analysis
- New Customers: Avg Order Value ranges from ₹202 to ₹2000, showing a wide disparity.
- Regular Customers: Avg Order Value ranges from ₹203 to ₹1995, indicating steady spending habits.
- Premium Customers: Avg Order Value ranges from ₹260 to ₹2000, highlighting their high purchase potential.
- Inactive Customers: Avg Order Value ranges from ₹205 to ₹1995, suggesting potential to be re-engaged with targeted promotions.
3. Customer Distribution by Location
- Highest concentration in major metro cities like Delhi NCR, Bengaluru, Mumbai, Chennai, and Hyderabad
- Meanwhile, cities like Pune, Ahmedabad, Lucknow, and Coimbatore show decent presence but clear room for growth. Targeted local marketing and improved logistics in these second-wave Tier 1 and Tier 2 hubs could significantly boost adoption.
Recommendations for Growth
- Boost Customer Retention & Engagement:
- Launch win-back campaigns with special incentives for Inactive Customers.
- Offer exclusive perks and rewards for Premium Customers.
- Target High-Value Segments:
- Implement subscription models or discounts for Regular Customers.
- Provide a seamless onboarding experience and personalized offers for New Customers.
- Expand Customer Base in Underrepresented Areas:
- Increase targeted advertising in smaller cities like Adoni and Agartala.
- Explore localized partnerships with regional sellers and logistic providers.
Delivery & Operational Performance
Speed Metrics: The Pulse of Blinkit's Delivery Excellence
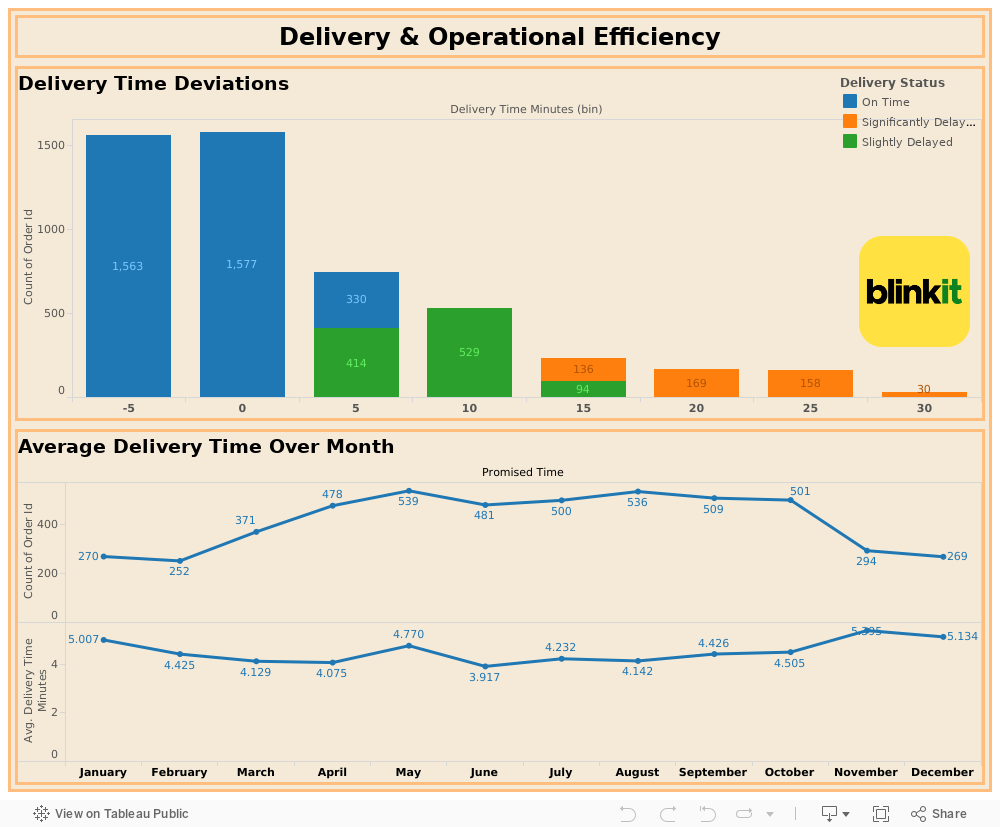
1. Delivery Time Deviations
- On-Time Deliveries: 1,577 orders met the expected delivery time.
- Slightly Delayed Deliveries: 529 orders had a minor delay (5–10 mins).
- Significantly Delayed Deliveries: 136 orders experienced a delay of more than 15 minutes.
2. Average Delivery Time Over the Months
- Fastest Delivery Month: June (3.92 minutes).
- Slowest Delivery Month: November (5.40 minutes).
- Average Delivery Time Variation:
- January: 5.01 minutes
- February: 4.42 minutes
- March: 4.12 minutes
- April: 4.07 minutes
- May: 4.77 minutes
- June: 3.19 minutes
- July: 4.23 minutes
- August: 4.14 minutes
- September: 4.42 minutes
- October: 4.50 minutes
- November: 5.40 minutes
- December: 5.13 minutes
Recommendations for Operational Efficiency
- Reduce Slight & Significant Delivery Delays:
- Optimize delivery partner routing algorithms to minimize last-mile inefficiencies.
- Improve warehouse-to-dispatch turnaround times.
- Address Peak-Season Delays:
- December and October have the slowest delivery times, requiring temporary staffing increases and logistics improvements.
- Implement predictive demand forecasting to manage workloads better.
- Improve Efficiency During Low-Performance Months:
- Increase fleet capacity during high-demand months like November and December.
- Leverage AI-driven route optimization to improve consistency.
- Enhance Customer Satisfaction Metrics:
- Notify customers about potential delays proactively to reduce complaints.
- Introduce an express delivery option for high-value customers.
Inventory & Product Performance
Stock Stories: Mastering the Art of Inventory Intelligence
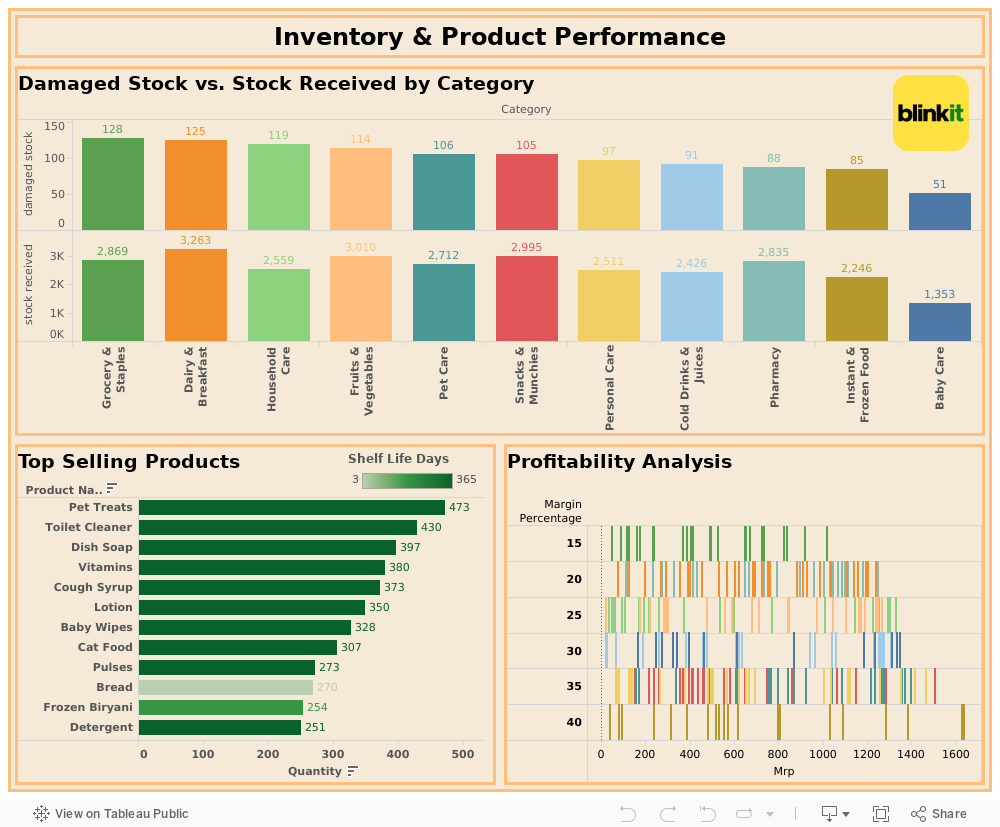
1. Category-wise Damage Analysis
- High-Risk Categories:
- Grocery & Staples: 128 damaged units out of 2,869 (4.46%)
- Dairy & Breakfast: 125 damaged units out of 3,263 (3.83%)
- Household Care: 119 damaged units out of 2,559 (4.65%)
- Low-Risk Categories:
- Baby Care: 51 damaged units out of 1,353 (3.77%)
- Instant & Frozen Food: 85 damaged units out of 2,246 (3.78%)
- Pharmacy: 88 damaged units out of 2,835 (3.10%)
2. Product Performance Analysis
- Top Performers by Volume:
- Pet Treats: 473 units (365-day shelf life)
- Toilet Cleaner: 430 units (365-day shelf life)
- Dish Soap: 397 units (365-day shelf life)
- Vitamins: 380 units (365-day shelf life)
- Highest Margin Categories:
- Instant & Frozen Food: 40% margin
- Pet Care: 35% margin
- Personal Care: 35% margin
- Snacks & Munchies: 35% margin
3. Shelf Life Analysis
- Long Shelf Life (365 days):
- Highest volume: Pet Treats, Toilet Cleaner, Dish Soap
- Lowest damage rates: Personal Care products
- Short Shelf Life (≤7 days):
- Bread: 270 units
- Eggs: 246 units
- Cheese: 182 units
- Requires special handling and quick turnover
4. Profitability Analysis
- High-Margin Categories:
- Instant & Frozen Food (40% margin)
- Frozen Pizza: MRP range ₹800-1,600
- Ice Cream: MRP range ₹1,000-1,600
- Frozen Biryani: MRP range ₹500-1,300
- Pet Care (35% margin)
- Pet Treats: MRP range ₹1,200-1,400
- Cat Food: MRP range ₹1,000-1,365
- Dog Food: MRP range ₹750-1,350
- Personal Care (35% margin)
- Premium Soaps: MRP range ₹1,000-1,460
- Lotions: MRP range ₹1,100-1,350
- Toothpaste: MRP range ₹1,000-1,350
- Instant & Frozen Food (40% margin)
- Low-Margin Categories:
- Grocery & Staples (15% margin)
- High volume but lowest margin category
- Essential items with price sensitivity
- Average MRP range ₹400-1,000
- Pharmacy (20% margin)
- Regulated pricing affects margins
- High MRP items (₹1,000-1,200) but lower margin
- Grocery & Staples (15% margin)
5. Strategic Recommendations
- Profitability Enhancement:
- Increase premium product mix in 35-40% margin categories
- Bundle high-margin products with essential items
- Optimize pricing strategy for premium segments
- Inventory Optimization:
- Implement dynamic reordering for high-volume items
- Optimize storage conditions for perishables
- Develop specialized handling protocols for high-risk categories
- Margin Enhancement:
- Focus on promoting high-margin categories
- Develop premium product lines in profitable segments
- Optimize pricing strategy based on shelf life
- Damage Prevention:
- Enhance storage infrastructure for Grocery & Staples
- Implement better handling protocols for Dairy products
- Regular staff training on product handling
6. Key Performance Metrics
40%
Highest Category Margin
15%
Lowest Category Margin
27.5%
Average Category Margin
Marketing Campaign Analysis

Campaign Canvas: Painting Success with Data-Driven Marketing
1. Campaign Performance Metrics
- Average ROAS Range: 1.51 to 4.00
- Total Number of Unique Campaigns: 9 distinct campaign types
- Campaign Distribution:
- New User Discount
- Weekend Special
- Festival Offer
- Flash Sale
- Membership Drive
- Category Promotion
- App Push Notification
- Email Campaign
- Referral Program
2. Revenue vs. Spend Analysis
- High Revenue Generators:
- Highest Revenue: ₹9,955.62 (Category Promotion - All)
- Notable High Revenue Campaigns:
- App Push Notification: ₹9,152.99
- Weekend Special: ₹9,623.97
- Membership Drive: ₹9,798.33
- Spend Efficiency:
- Most Efficient (High ROAS):
- Festival Offer (New Users): 4.00 ROAS (₹2,947.82 revenue / ₹1,318.85 spend)
- Email Campaign (Premium): 3.92 ROAS (₹2,156.09 revenue / ₹1,457.88 spend)
- Category Promotion (Inactive): 3.89 ROAS (₹6,697.88 revenue / ₹2,714.78 spend)
- Most Efficient (High ROAS):
3. Target Audience & Campaign Performance
- Premium Users:
- Average ROAS: 3.2
- Best performing campaigns: Email Campaign, New User Discount
- New Users:
- Average ROAS: 2.8
- Strong performance in Festival Offers and Category Promotions
- Inactive Users:
- Average ROAS: 2.6
- Moderate performance across most campaigns
- All Users:
- Average ROAS: 2.7
- Consistent performance across various campaigns
4. Campaign Effectiveness by Type
- Top Performing Campaigns:
- Festival Offer (4.00 ROAS)
- Email Campaign (3.92 ROAS)
- Category Promotion (3.89 ROAS)
- Moderate Performing Campaigns:
- Weekend Special (2.98 ROAS)
- Flash Sale (2.84 ROAS)
- Membership Drive (2.22 ROAS)
- Lower Performing Campaigns:
- Referral Program (1.62-1.70 ROAS)
- Flash Sale to New Users (1.53-1.86 ROAS)
Recommendations for Optimizing Campaign Performance
- 1. Audience Targeting Optimization
- Focus on Premium users for Email Campaigns and New User Discounts
- Develop specialized content for New Users in Festival Offers
- Create re-engagement strategies for Inactive users
- 2. Campaign Budget Allocation
- Increase investment in high-ROAS campaigns (Festival Offer, Email Campaign)
- Reduce spending on lower-performing Referral Programs
- Optimize spend distribution based on audience segment performance
- 3. Campaign Strategy Refinement
- Replicate successful elements of high-performing campaigns
- A/B test different offer structures for lower-performing campaigns
- Develop hybrid campaigns combining successful elements of multiple campaigns
- 4. Performance Monitoring and Optimization
- Implement real-time ROAS tracking
- Set up automatic budget adjustments based on performance thresholds
- Regular analysis of campaign metrics for continuous improvement
- 5. Innovation and Testing
- Experiment with new campaign types for different audience segments
- Test various creative elements and messaging strategies
- Implement seasonal variations of successful campaigns
Customer Sentiment Analysis

Voice of the Customer: Decoding Digital Satisfaction
1. Overall Customer Satisfaction Metrics
- Total Reviews Analyzed: 5,000 customer feedbacks
- Overall Satisfaction Score: 3.35 out of 5
- Customer Sentiment Distribution:
- Highly Satisfied (⭐⭐⭐⭐⭐): 816 (16.3%)
- Satisfied (⭐⭐⭐⭐): 1,708 (34.2%)
- Neutral (⭐⭐⭐): 1,398 (28.0%)
- Dissatisfied (⭐⭐): 538 (10.8%)
- Highly Dissatisfied (⭐): 540 (10.8%)
2. Service Category Performance
- Delivery Services:
- Highest rated category
- 85% positive feedback rate
- Key Strength: On-time delivery and professional delivery staff
- Mobile Application:
- Second-highest rated service
- 82% positive feedback rate
- Key Strength: User interface and ease of ordering
- Product Experience:
- Consistent performance
- 82% satisfaction rate
- 18% reported quality concerns
- Customer Support:
- Area needing most improvement
- 25% negative feedback rate
- Key Issues: Response time and resolution quality
3. Customer Loyalty Indicators
- Net Promoter Score Components:
- Brand Promoters: 16.3% of customers
- Neutral Customers: 62.2% of base
- Potential Detractors: 21.6% of users
- Customer Retention Risk:
- High Risk (1-2 ⭐): 21.6%
- Moderate Risk (3 ⭐): 28.0%
- Low Risk (4-5 ⭐): 50.5%
4. Action Plan for Customer Experience Enhancement
- Immediate Priority Actions:
- Customer Service Reform:
- Implement 24/7 support channels
- Reduce response time to under 2 hours
- Enhanced training for support staff
- Quality Control Enhancement:
- Strengthen vendor quality checks
- Implement real-time quality monitoring
- Enhance packaging standards
- Customer Service Reform:
- Medium-Term Improvements:
- App Enhancement:
- Regular feature updates based on feedback
- Improved search and filter options
- Enhanced order tracking capabilities
- Delivery Optimization:
- Expand delivery fleet coverage
- Implement AI-driven route optimization
- Enhanced delivery time predictions
- App Enhancement:
- Long-Term Strategic Initiatives:
- Implement automated feedback analysis system
- Develop predictive customer satisfaction models
- Create personalized service recovery programs
Final Strategic Recommendations & Key Takeaways
Strategic Symphony: Orchestrating Blinkit's Future Growth
1. Revenue & Payment Optimization
- Digital Payment Growth:
- Leverage card transaction momentum (4.77% growth) with targeted cashback
- Revive UPI usage (counter 1.75% decline) through merchant partnerships
- Implement wallet-specific promotions to reverse 2.98% decline
- Seasonal Strategy:
- Focus marketing during peak months (May-July) across all payment methods
- Develop special promotions for low-performance months (November-December)
2. Customer Segment Optimization
- Segment-Specific Engagement:
- Premium Users: Focus on high-margin categories (35-40%) and exclusive access
- Regular Customers (6,598 orders): Implement subscription models
- New Users (6,829 orders): Enhanced onboarding with category-specific offers
- Inactive Users (6,350 orders): Re-engagement through personalized campaigns
- Geographic Expansion:
- Strengthen presence in Tier 1 cities with full-category offerings
- Customize assortment for Tier 2 cities based on local preferences
3. Operational & Inventory Excellence
- Delivery Optimization:
- Reduce delivery delays from current 136 significant delays
- Maintain sub-4-minute delivery average (current best: 3.92 mins)
- Implement AI-driven route optimization for peak hours
- Inventory Management:
- Reduce damage rates in high-risk categories (currently 4.46% in Grocery)
- Optimize storage for 40% margin categories (Frozen Foods)
- Special handling protocols for perishables (≤7 days shelf life)
4. Marketing & Campaign Strategy
- High-ROI Campaign Focus:
- Scale Festival Offers (4.00 ROAS)
- Expand Email Campaigns (3.92 ROAS)
- Optimize Category Promotions (3.89 ROAS)
- Segment-Based Marketing:
- Premium Users: Focus on 35-40% margin categories
- New Users: Bundle high-margin with essential items
- Inactive Users: Personalized re-engagement offers
5. Customer Experience Enhancement
- Service Quality:
- Improve satisfaction score from 3.35 to target 4.0
- Reduce negative feedback rate from 25% to 15%
- Implement 24/7 customer support with 2-hour response time
- Product Quality:
- Enhance vendor quality checks for perishables
- Implement real-time quality monitoring
- Strengthen packaging standards for fragile items
6. Key Performance Targets
40%
Target High-Margin Category Share
4.0
Target Customer Rating
3.5+
Target Campaign ROAS